Health Gap Measures
Rate Ratio (RR)
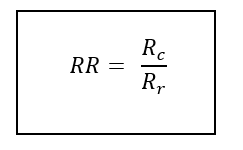
The rate ratio (RR) is a relative comparison of the rate of a health-related outcome between a comparison group and a reference group. Generally, the reference group is the more advantaged social group. The RR measures the relative size of the health gap– it shows us how many times higher or lower the rate of an outcome is in a particular social group compared to the reference group. The RR is measured by dividing the rate of the outcome in the comparison group (c) by the rate in the reference group (r).
RR that is equal to 1 implies that the rate in the comparison group is the same as the rate in the reference group.
RR greater than 1 implies that the rate in the comparison group is higher than the rate in the reference group.
RR less than 1 implies that the rate in the comparison group is lower than the rate in the reference group.
To know for sure whether the RR is showing a significant health gap, we must consider whether the confidence interval of the RR crosses 1. If the confidence interval does not cross 1, the RR is considered statistically significant. If the confidence interval crosses 1, the RR is not considered statistically significant.
Example 1
In Region A, the overall prevalence of excellent or very good self-rated mental health is 71%. We would like to see if there is a health gap between individuals who are considered to be living at a lower income level versus those living at a higher income level. And we would like to see if this gap is experienced differently between males and females. The prevalence of excellent or very good mental health is stratified by sex and income in Table 1.
| Sex | Lower income | Higher income |
|---|---|---|
| Males | 61.5% | 82.1% |
| Females | 58.4% | 79.0% |
| Total | 59.7% | 80.7% |
Overall, not considering sex:
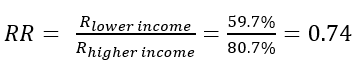
This implies that the rate of excellent or very good mental health in the lower income group is 0.74 times that of the higher income group. This means that the rate of excellent or very good mental health is lower in the lower income group compared to the higher income group. The confidence interval is calculated to range from 0.72 to 0.76 and does not include 1, therefore the RR is statistically significant.
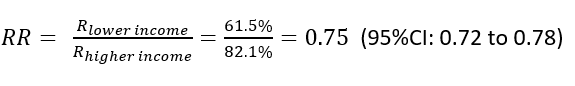
Among males:
Among females:
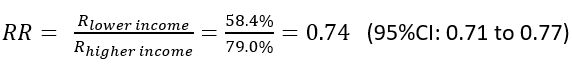
When looking at the RRs for males and females, the confidence intervals overlap. This means they are not statistically significantly different from one another. This means that the RR for income does not vary by sex.
However, the confidence intervals for each of the RRs (males and females) do not include 1, so the health gap measures are statistically significant. This means that the rate of excellent or very good mental health in males and females is lower in the lower income group compared to the higher income group.
Rate Difference (RD)
The RD is an absolute comparison of the rate of a health-related outcome between a comparison group and a reference group. Generally, the reference group is the more advantaged social group. The RD is a measure of the absolute size of the health gap. It shows the potential public health burden of being in a particular social group – the number of cases of the outcome that could potentially be avoided or gained if the comparison group had the same rate as the reference group. The RD is measured by subtracting the rate of the outcome in the reference group from the rate in the comparison group.
An RD equal to 0 implies that the rate in the comparison group is the same as the rate in the reference group. The number of cases in the comparison group is neither higher nor lower than that in the reference group.
An RD greater than 0 implies that there are more cases of the outcome in the comparison group compared to the reference group.
An RD less than 0 implies that there are fewer cases of the outcome in the comparison group compared to the reference group.
To know for sure whether the RD is showing a significant health gap, we must consider whether the confidence interval of the RD crosses 0. If the confidence interval does not cross 0, the RD is considered statistically significant. If the confidence interval crosses 0, the RD is not considered statistically significant.
Example 2
Let’s go back to the example for RR and Table 1. We would like to first calculate the overall RD for excellent or very good mental health between lower and higher income groups, then for males and females separately.
Overall, not considering sex:

This means that there are 21 fewer cases that have excellent or very good self-rated mental health per 100 people in the lower income group, compared to the higher income group. The confidence interval is calculated to range from -21.6% to -19.2% and does not include 0, therefore the RD is statistically significant.
Among males:

The 95%CI is calculated to be: -22.2% to -18.6%.
Among females:

The 95%CI is calculated to be: -21.8% to -18.4%.
When looking at the RRs for males and females, the confidence intervals overlap. This means they are not statistically significantly different from one another. This means that the RR for income does not vary by sex.
However, the confidence intervals for each of the RRs (males and females) do not include 1, so the health gap measures are statistically significant. This means that the rate of excellent or very good mental health in males and females is lower in the lower income group compared to the higher income group.